When auditing web applications built on Supabase, we (developers and security reviewers) need tools that let us inspect database traffic, test Row Level Security (RLS) policies, and detect API key leaks—all without leaving the browser or switching to external tools like Postman or cURL. That’s why I built
SupaHack in the first place, and now I'm releasing it as SupaExplorer, a Chrome extension that brings Supabase security testing plus comprehensive API key leak detection together in one tool.
SupaHack, enabled you to explorer a Supabase instance by copy and pasting your project ID, and keys. It was a great tool, but it was way too technical for most people, and you needed to go through you page network requests to find the credentials. That's why I decided to simplify it, and build a Chrome extension that would automatically detect Supabase traffic, and provide an in-page database explorer.
SupaExplorer enables us to stress-test Supabase RLS policies and catch exposed credentials from 30+ popular services, all while staying in context on the page under test. The extension automatically detects Supabase traffic, captures credentials in real-time, provides an in-page database explorer, and scans network responses for leaked API keys.
In this article
The problem: Why existing tools fall short
When security testing Supabase applications, you typically need to:
- Capture live credentials from the application's network traffic
- Test RLS policies by querying tables with different authentication contexts
- Browse database schemas to understand table structures and relationships
- Detect API key leaks in bundled JavaScript and network responses
- Generate security reports documenting findings and recommendations
Back when I started security testing Supabase apps, I used to follow the same multi-step process Khaled details in his excellent article "Hacking Thousands of Misconfigured Supabase Instances": open DevTools, copy network headers, switch to Postman or another tool, configure requests, test and document findings, then switch back, and repeat. This routine is tedious, prone to errors, and constantly disrupts your flow state. Plus, it’s easy to miss credentials hidden in JavaScript bundles or only notice Supabase connections after manually digging through network traffic.
The core insight: security testing tools should keep you in context, not force you to juggle multiple applications. If you're testing a Supabase app, you should be able to explore its database directly from the page, using the exact same credentials the page is using. At least, that's my personal preference.
Supabase security testing features
SupaExplorer addresses these pain points with several integrated features:
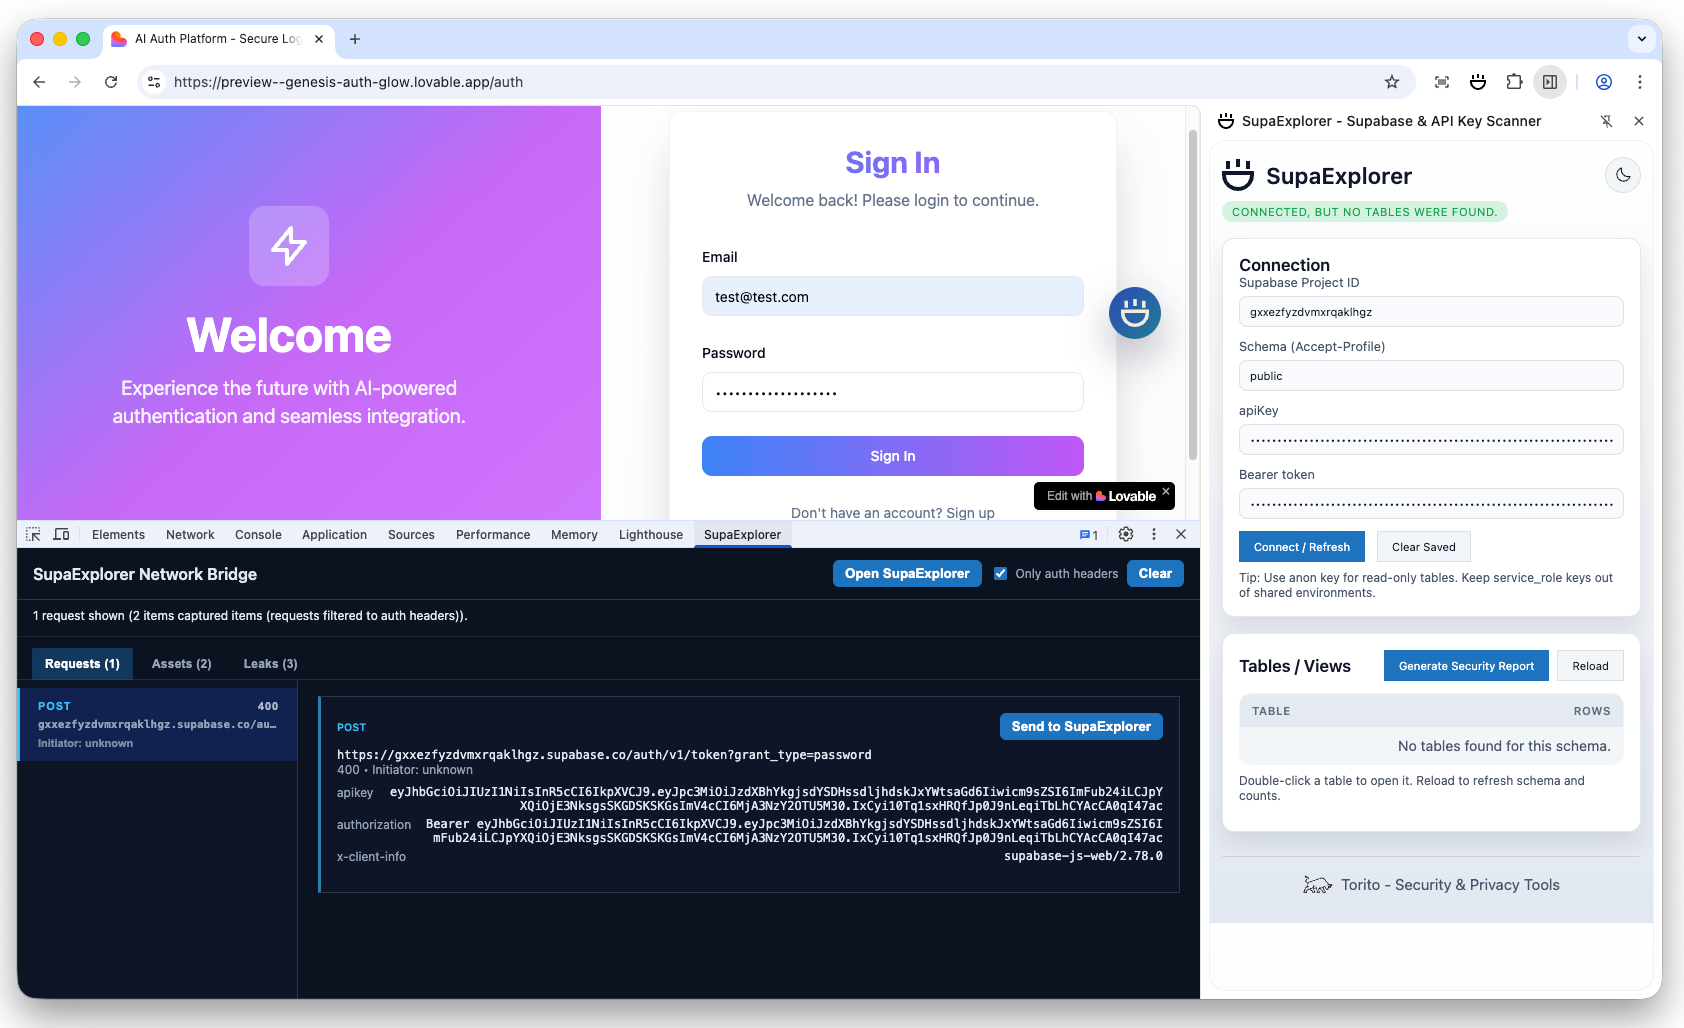
Automatic request detection
The extension instruments both fetch and XMLHttpRequest to detect Supabase API calls in real-time. When it sees a request to *.supabase.co, it extracts the project ID, API key, and schema, then normalizes these credentials for use in the explorer. This happens automatically, without any manual configuration needed.
Side panel for table browsing
I tired different approaches, like using a modal overlay, or a floating window. But in the end, I decided to use Chrome's side panel API, because it provides a persistent UI that doesn't clutter the page or mess with its content. SupaExplorer uses it to display:
- Auto-filled connection form with detected project ID and API key
- Schema selector to switch between different database schemas
- Table list with row count probes that surface 401/permission-denied responses
- RLS status indicators showing which tables are accessible and which are blocked
Row counts are particularly useful: if a table returns a 401 error, you know RLS is blocking access. If it returns a count, you can see how many rows are exposed, which is critical for understanding data exposure risk. As an example, a quick count of a high profile table count can tell you something is definitely off and you should investigate further.
In-page explorer overlay
Double-clicking a table (or clicking "Open Explorer") launches a full-screen overlay that lets you browse data, run filtered queries, and test CRUD operations. The overlay reuses the exact headers the page sent, so you're testing with the same authentication context the application uses.
The explorer includes:
- Browse tab: View table data with pagination and column selection
- Insert tab: Test write permissions by inserting rows
- Update tab: Modify existing rows to test update policies
- Delete tab: Verify delete restrictions are properly enforced
DevTools integration
The DevTools panel shows a live feed of Supabase requests, making it easy to see what the application is doing. More importantly, it scans captured JavaScript bundles and JSON responses for hard-coded Supabase credentials. Even if no request has fired yet, if a bundle contains a Supabase URL and API key, SupaExplorer will surface it. This is particularly useful for detecting API key leaks in preloaded bundles, like Next.js chunks, or in instances where a regular extension is not allowed to peak due to browser policies.
Security report generation
Clicking "Generate Security Report" compiles a printable PDF-friendly summary that includes:
- All detected tables and their row counts
- RLS policy findings (which tables are protected, which are exposed)
- Risk assessment and remediation recommendations
- Exposed API keys and credentials found during scanning
I didn't thought about this initially, but it was suggested by Ariel Mathov from 021, and I believe it was a great addition.
Architecture and technical design
SupaExplorer is built on Manifest V3, Chrome's latest extension architecture. The extension consists of several interconnected components:
hooks fetch/XHR"] bubble["content/bubble.js
detection UI"] overlay["content/content.js
overlay bridge"] explorer["explorer/explorer.html/js
database UI"] end subgraph Background["background/background.js
service worker"] bg["Handles detection, storage,
messaging, side panel control"] end subgraph DevTools["DevTools panel"] devtools["devtools_panel.html/js
captures & forwards credentials"] leaksTab["Leaks tab
displays detected API keys"] end subgraph LeakDetection["Leak Detection"] scanner["shared/leak_scanner.js
pattern matching"] interceptor["webRequest listener
captures responses"] end storage[("chrome.storage.local
connection + report data")] supabase[("Supabase REST endpoints")] detector -->|"SBDE_SUPABASE_REQUEST"| bg devtools -->|"SBDE_APPLY_CONNECTION"| bg bg -->|"store connection"| storage bg -->|"openSidePanel"| sidepanel bg -->|"SBDE_OPEN_OVERLAY"| overlay overlay --> explorer sidepanel -->|"fetch OpenAPI"| supabase explorer -->|"browse/modify tables"| supabase interceptor --> scanner scanner --> leaksTab
Manifest V3 and service workers
Unlike Manifest V2's persistent background pages, V3 uses service workers that can be terminated and restarted. This required careful state management: credentials and connection state are stored in chrome.storage.local rather than in-memory variables. The service worker handles:
- Message passing between content scripts, side panel, and DevTools
- Opening and managing the side panel via
chrome.sidePanelAPI - Web request interception for API key leak scanning
- State synchronization across all extension components
Request detection and interception
The extension injects a content script (detector_inject.js) that wraps the native fetch and XMLHttpRequest APIs. When a request is made to *.supabase.co, the wrapper:
- Extracts the project ID from the URL pattern
- Captures the
apikeyheader or query parameter - Identifies the schema (defaults to
publicif not specified) - Sends a message to the background service worker with the credentials
The background worker normalizes and stores these credentials, then sends a message back to show the detection bubble UI.
UI components and integration
SupaExplorer uses three main UI surfaces:
- Side panel: Built with vanilla JavaScript, connects to the background via
chrome.runtime.sendMessageand listens to storage changes viachrome.storage.onChanged - Explorer overlay: An iframe injected into the page, loaded from
explorer/explorer.html, communicates with the background via postMessage - DevTools panel: Uses the DevTools API to capture network requests and display them in a custom panel
All three components read connection state from chrome.storage.local, ensuring they stay in sync. When you navigate away from the page or credentials disappear, the background worker clears the stored connection to prevent stale data.
API key leak detection system
Beyond Supabase testing, SupaExplorer includes a comprehensive API key leak scanner that detects exposed credentials from 30+ popular services. The scanner recognizes patterns for:
- Cloud providers: AWS, Google Cloud, Azure, Heroku
- Payment processors: Stripe, PayPal
- APIs and services: OpenAI, GitHub, SendGrid, Twilio, Slack, Mailgun
- And many more: Firebase, Auth0, Datadog, and others
How the scanner works
The scanner intercepts network responses via Chrome's webRequest API. When a response is received, it:
- Filters content types: Automatically excludes CSS, fonts, and binary files by default
- Extracts text content: Parses JavaScript, HTML, and JSON responses
- Runs pattern matching: Tests each pattern against the content using regex
- Validates matches: Uses entropy analysis for AWS keys, checks format validity
- Filters false positives: Maintains a deny list of known false positives
- Deduplicates: Shows each unique leak only once per source
When a leak is detected, it appears immediately in the DevTools "Leaks" tab with the matched value, pattern type, surrounding context, and source URL. All scanning happens locally, no data leaves your machine.
Smart filtering to reduce false positives
False positives are a major challenge in API key detection. SupaExplorer uses several techniques to minimize them:
- File extension filtering: Excludes
.css,.scss,.woff,.ttfand other non-code files - Base64 detection: Skips base64-encoded font/image data URIs that might trigger false matches
- Entropy analysis: For AWS keys, checks Shannon entropy to filter out repetitive patterns (e.g., "AAAAAAA...")
- Deny list: Maintains a list of known false positive patterns to ignore
I had to work a lot on improving this, because I was getting way to many false positives, specially for AWS keys.
The building process
Initial prototype and challenges
I started with a simple prototype that only detected Supabase requests and displayed them in DevTools. The initial challenge was understanding Manifest V3's service worker lifecycle, credentials stored in memory would disappear when the worker was terminated. Moving state to chrome.storage.local solved this, but introduced new complexity around state synchronization.
Another early challenge was the side panel API, which is relatively new. The panel needs to be registered per tab, and opening it programmatically required careful timing. I also learned that content scripts can't directly access the side panel's DOM, all communication must go through the background worker.
Iterative development
The extension grew organically. After getting basic detection working, I added:
- Table enumeration: Fetching the PostgREST OpenAPI schema to list tables
- Row count probes: Testing SELECT permissions by attempting count queries
- Explorer overlay: Building a full CRUD interface that reuses page credentials
- Report generation: Compiling findings into a printable security report
- API key scanning: Adding comprehensive leak detection beyond Supabase
Each feature required testing against real Supabase applications. I found edge cases around schema switching, RLS error handling, and credential expiration that weren't obvious from the documentation.
Key technical decisions
Several decisions shaped the extension's architecture:
- Vanilla JavaScript: No framework dependencies means faster load times and easier debugging
- PostgREST API: Directly using Supabase's PostgREST endpoints rather than the client library keeps the codebase simpler
- Storage-based state: Using
chrome.storage.localfor all state ensures persistence across service worker restarts - Pattern-based scanning: For API key detection, regex patterns are more maintainable than ML models for this use case
- Local-only processing: All scanning and analysis happens in the browser, no external API calls
I tend to avoid frameworks and libraries when possible, because they add complexity and can be a source of bugs. I also prefer to keep the codebase simple and easy to understand to anybody that wants to contribute to the project.
Real-world use cases
SupaExplorer is designed for several distinct user groups:
Security engineers
When validating Supabase RLS policies before production launch, security engineers can use SupaExplorer to:
- Quickly identify tables with missing or overly permissive RLS policies
- Test whether authenticated users can access data they shouldn't
- Generate security reports for compliance documentation
- Scan for accidentally committed API keys in bundled JavaScript
Red teams and penetration testers
During security engagements, red teams can use SupaExplorer to:
- Map out the database schema without manual inspection
- Probe RLS policies to find potential bypasses
- Identify exposed credentials in client-side code
- Document findings for penetration test reports
Developers auditing their own apps
Developers can use SupaExplorer during code review to:
- Catch hard-coded Supabase keys before they reach production
- Verify RLS policies are correctly configured
- Test database access patterns during development
- Ensure no sensitive data is exposed through overly permissive queries
Privacy and security considerations
Privacy and security were top priorities when building SupaExplorer:
- Local-only processing: All credentials, leak reports, and analysis stay in
chrome.storage.local. Nothing leaves your machine,no telemetry, no external API calls, no data transmission. - Automatic cleanup: When you navigate away from a page or credentials disappear, the extension automatically clears stored connection data to prevent stale credentials.
- Respects RLS: SupaExplorer highlights permission errors rather than trying to bypass them. It's a security testing tool, not an exploit.
- Minimal permissions: The extension only requests the permissions it needs:
sidePanel,tabs,scripting, andwebRequest.
However, it's important to note that SupaExplorer is a powerful tool that can expose sensitive data if used inappropriately. It should only be used for authorized security testing, code reviews, and incident response, never for malicious purposes.
Future directions and improvements
There are several areas where SupaExplorer could evolve:
- Enhanced RLS testing: Automated policy testing with different user roles and authentication contexts
- Query builder improvements: More sophisticated filtering, sorting, and relationship traversal in the explorer
- Export formats: CSV/JSON export for table data, more report formats beyond PDF
- Pattern library expansion: Adding more API key patterns for additional services
- Collaboration features: Sharing scan results and findings with team members
- Integration with other tools: Exporting findings to ticketing systems or security platforms
The extension is open-source, so contributions and feedback are welcome. The codebase is structured to make it easy to add new features, and the pattern-based approach for API key detection makes adding new services straightforward.
Final thoughts
Building SupaExplorer made me learn more about Chrome extension development, Manifest V3's service worker model, and the challenges of building security testing tools that stay in context. The extension solves a real problem for security reviewers and developers working with Supabase applications, and I'm happy to share it with the community.
I thought a lot about making the extension paid, or with certain features only available to paying users. But in the end, I decided to keep it free and open-source, because I want to help the community and make it easier for everyone to audit their Supabase applications.
If you're working with Supabase applications or doing security testing, I encourage you to try SupaExplorer. The extension is available on GitHub, and feedback from the security community helps drive improvements.